InHouse America
Impact of Gasoline Prices on U.S. Consumers (2014-2024)
Published: 13:31 pm (GMT-5), Mon August 26, 2024
2 Minute Read
Source: (U.S. Energy Information Administration Gasoline Prices)
2014 - 2016 Declining Prices, Increased Savings
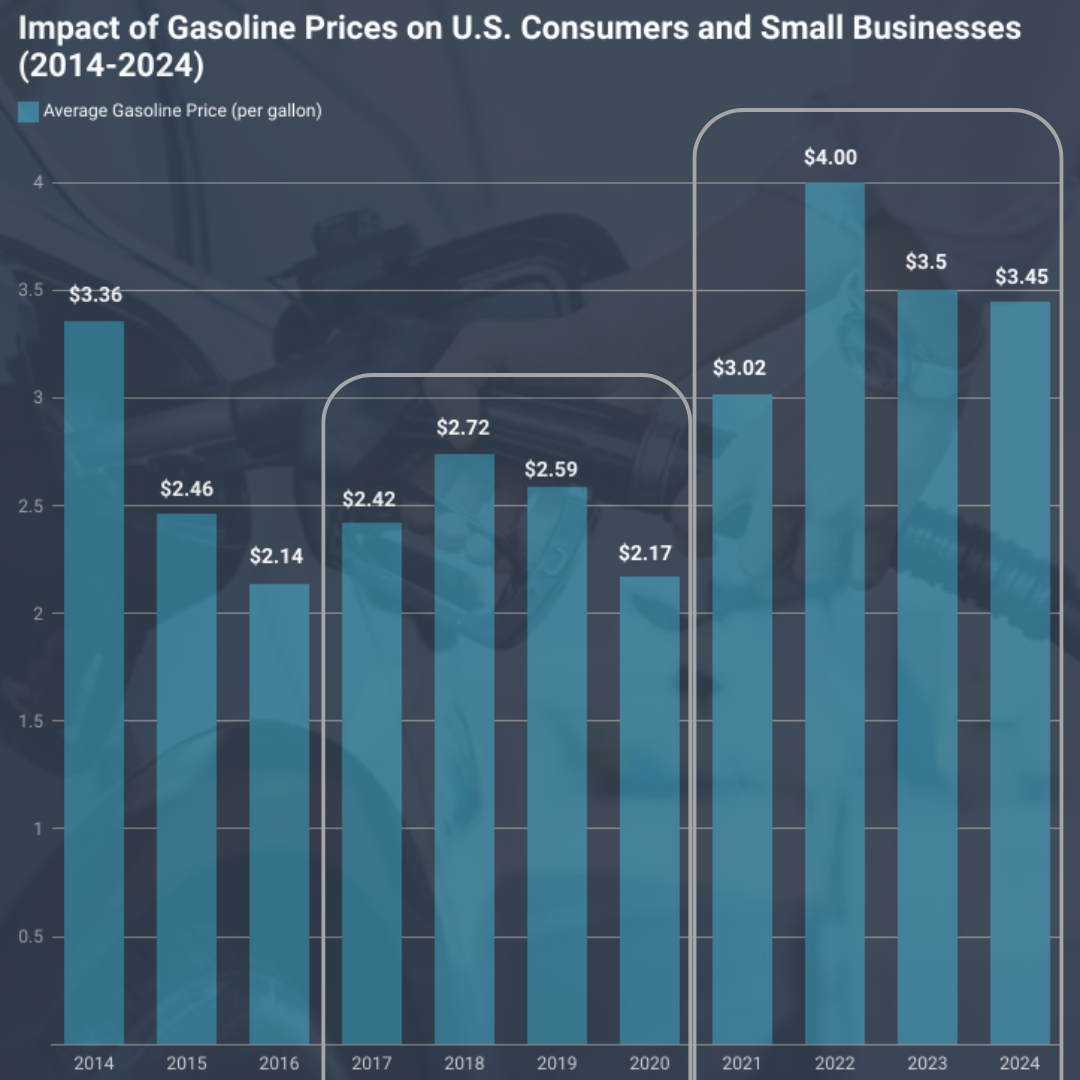
Gasoline prices fell from $3.36 per gallon in 2014 to $2.14 per gallon in 2016, representing a 36% decrease.
Source: (U.S. Energy Information Administration (EIA), U.S. Bureau of Economic Analysis (BEA)
Insights: This saved U.S. households around $1,464 annually, equivalent to $122 per month, as the average household consumes about 1,200 gallons of gasoline per year. This additional disposable income led to a 3.5% growth in retail sales in 2016, compared to 2.8% in 2015
2017 - 2019 Rising Prices, Budget Strain
Gasoline prices increased from $2.42 per gallon in 2017 to $2.74 per gallon in 2018, a 13% rise, adding approximately $384 annually to household gasoline expenses.
Source: (U.S. Energy Information Administration (EIA), U.S. Bureau of Labor Statistics (BLS))
Insights: This increase led to a shift in consumer spending, with the share of household income spent on transportation rising from 13.5% in 2016 to 14.3% in 2018, resulting in a 0.7% reduction in spending on entertainment and dining.
2020 Pandemic Savings Amid Economic Hardship
During the COVID-19 pandemic, gasoline prices fell to $2.17 per gallon in 2020, a 17% decrease from 2019 levels, saving households about $516 annually.
Source: (U.S. Energy Information Administration (EIA), U.S. Bureau of Labor Statistics (BLS))
Insights: However, with the unemployment rate peaking at 14.8% in April 2020, many households faced significant financial challenges, offsetting the benefits of lower fuel costs.
2021 - 2022 Price Surge, Inflation Pressure
Gasoline prices surged to $3.02 per gallon in 2021, a 39% increase from 2020 levels, and exceeded $4.00 per gallon in mid-2022,nearly doubling from 2020 levels.
Source: (U.S. Energy Information Administration (EIA), U.S. Bureau of Labor Statistics (BLS))
Insights: This surge added between $1,020 and $2,000 to annual household expenses and contributed to a 7.0% inflation rate in 2021, the highest in decades, reducing consumer purchasing power by 4.6%.
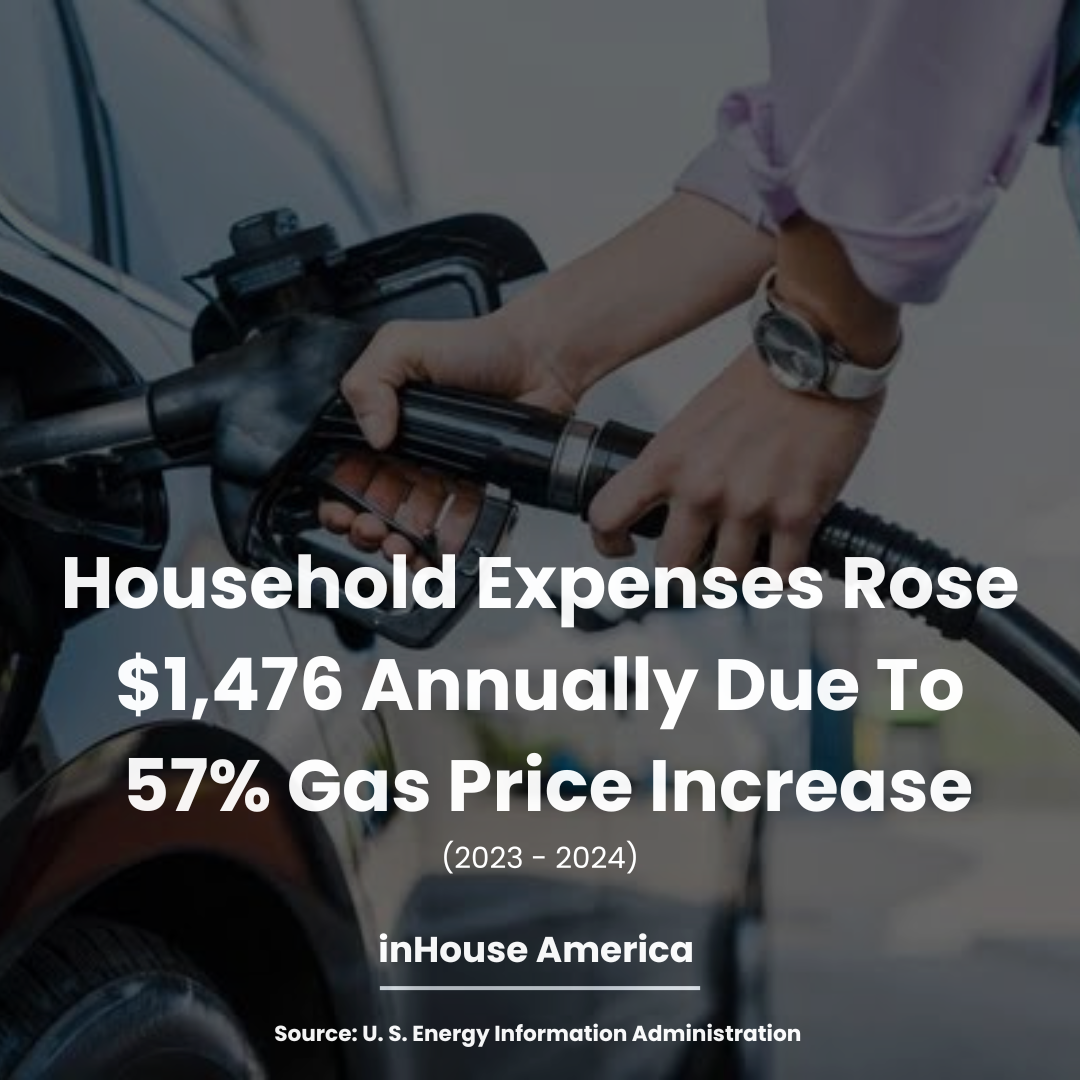
2023 - 2024 Stabilization and Inflationary Pressures
In 2023, gasoline prices stabilized at around $3.50 per gallon, reflecting a moderation in the earlier surge. This price level added about $1,620 annually to household expenses compared to pre-2021 levels. In 2024, prices remained relatively steady, averaging $3.45 per gallon.
Source: U.S. Energy Information Administration (EIA), U.S. Bureau of Labor Statistics (BLS)
Insights: Despite this stability, inflationary pressures from other sectors continued to impact household budgets, with the inflation rate remaining elevated at around 5.0% for 2023. This ongoing inflation reduced real income growth and continued to affect consumer spending patterns.
Source: (U.S. Energy Information Administration Gasoline Pricess)
2016 - 2024 inHouse America Summary
From 2016 to 2024, gasoline prices had a significant impact on small businesses. The 36% drop in prices by 2016 increased profitability by 10%, allowing businesses to grow. However, rising prices from 2017-2019 led to a 5-7% reduction in revenue as costs increased. The pandemic brought temporary relief in 2020, but the sharp 39% price surge in 2021-2022 caused a 15% revenue decline. Small businesses had to adapt to these fluctuations to survive and thrive and why we work very hard at inHouse America to offer free advertising to small American businesses.
Source: U.S. EIA, BLS, NFIB, SBEC
inHouse America doesn't endorse anyone but focuses on creating awareness of the importance of supporting small businesses and which administration is best for doing so!